> For the complete documentation index, see [llms.txt](https://stader.gitbook.io/stader/llms.txt). Markdown versions of documentation pages are available by appending `.md` to page URLs; this page is available as [Markdown](https://stader.gitbook.io/stader/ethereum/node-operator/permissionless-node-operator/node-monitoring.md).
# Node Monitoring
To ensure you have a seamless experience monitoring your node, we have developed a user-friendly Grafana Dashboard that enables you to easily keep track of primary metrics. Please follow the below steps to configure Grafana Dashboard for your node
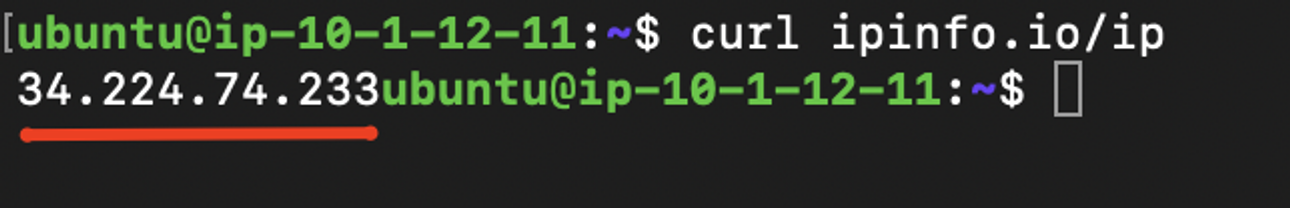
### **Step 1: Get IP Address**
Get the IP address of your machine or the cloud instance. To get your public IP you can run this command: `curl ipinfo.io/ip`
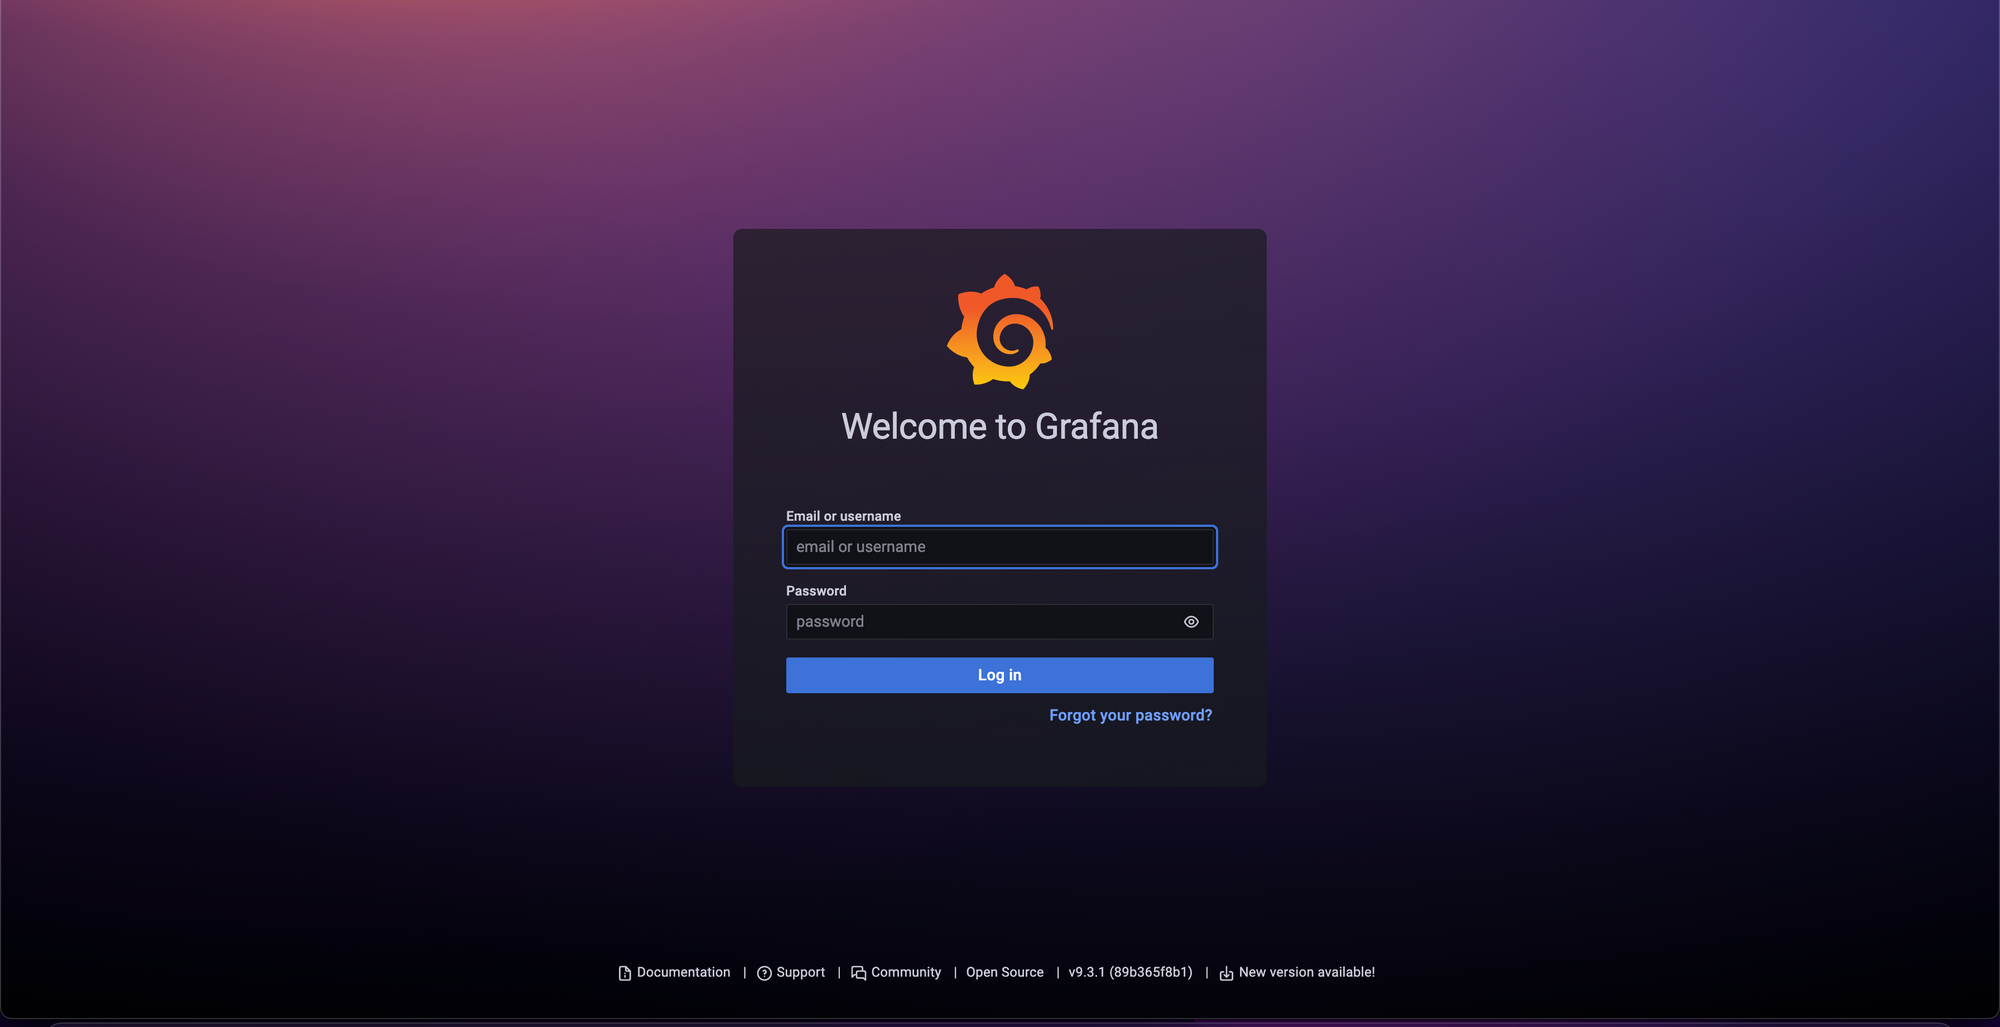
### **Step 2: Access Grafana**
Access Grafana by entering this URL in your browser: `http://:3100`
**Note: Please replace \\\ with your machine or instance’ IP address.**
* You will see a login screen. The username and password is : admin
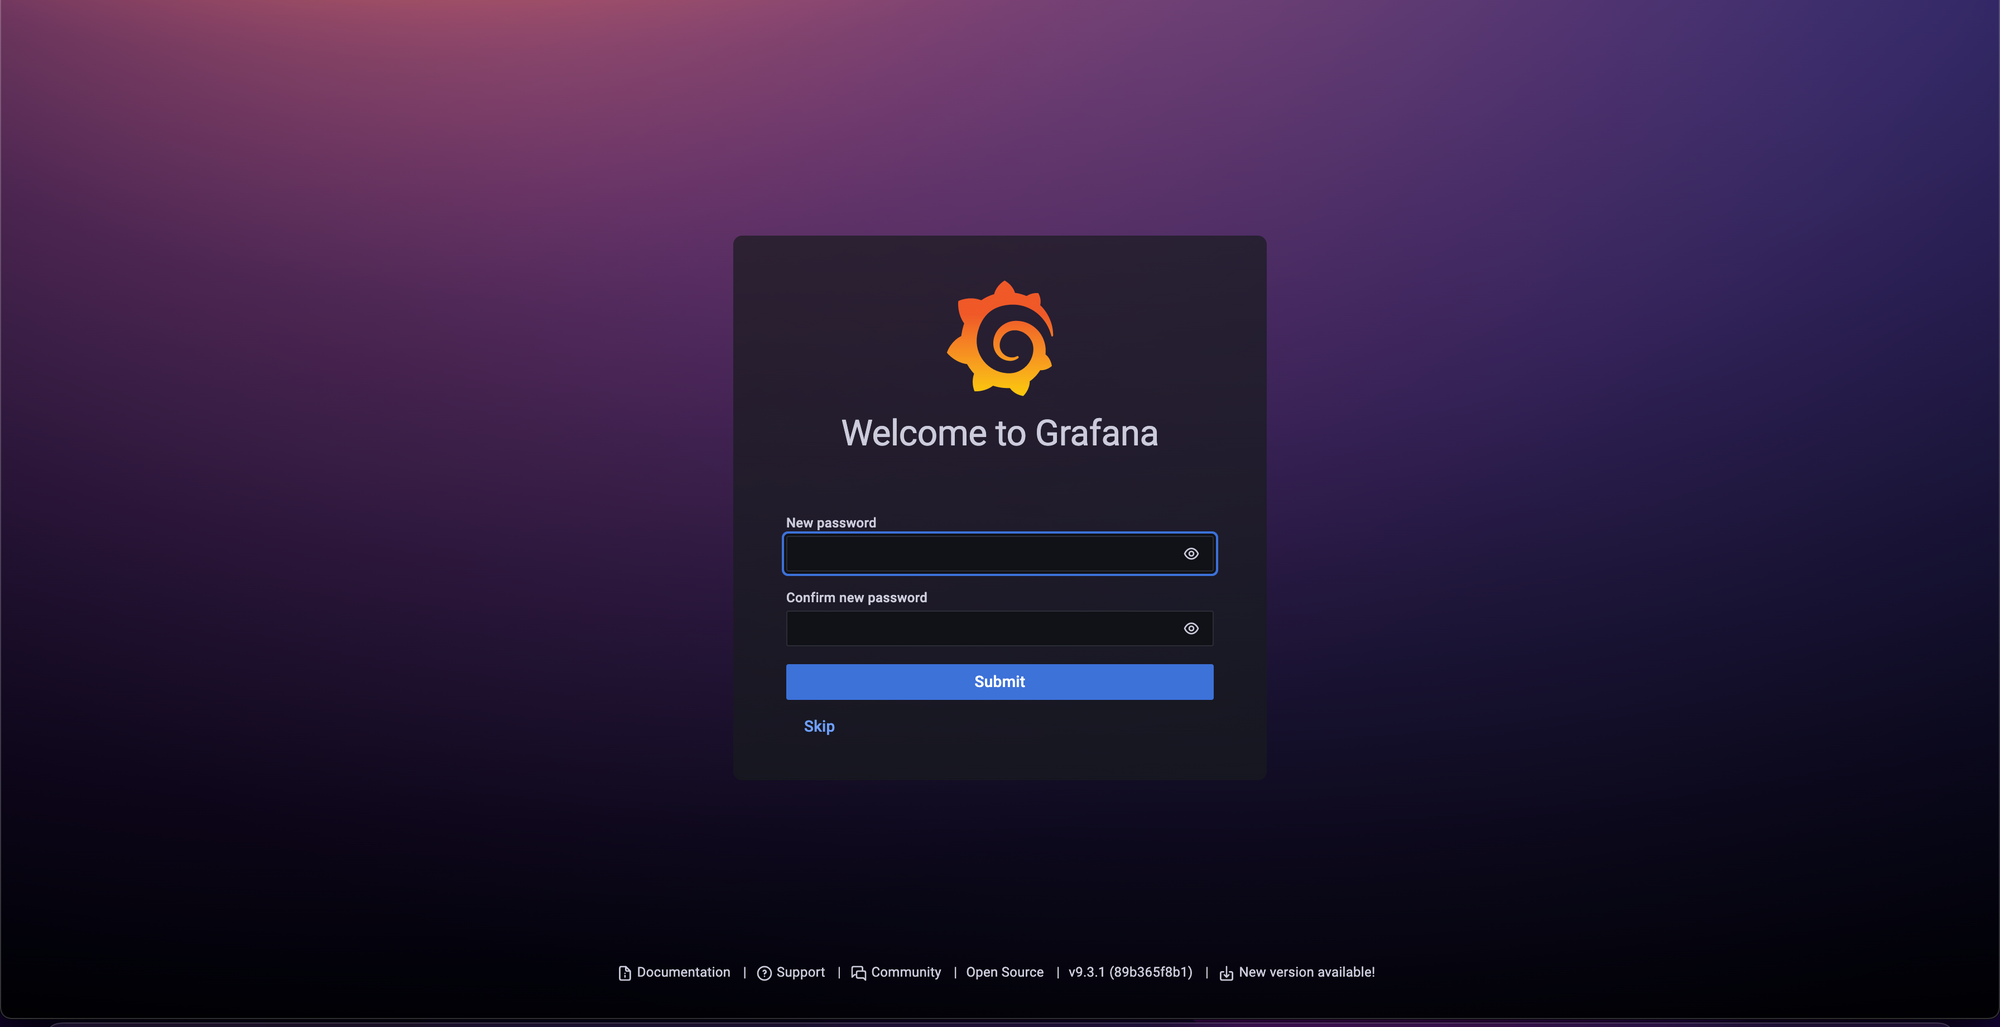
* You will be prompted to change your password. You can change it or skip it.
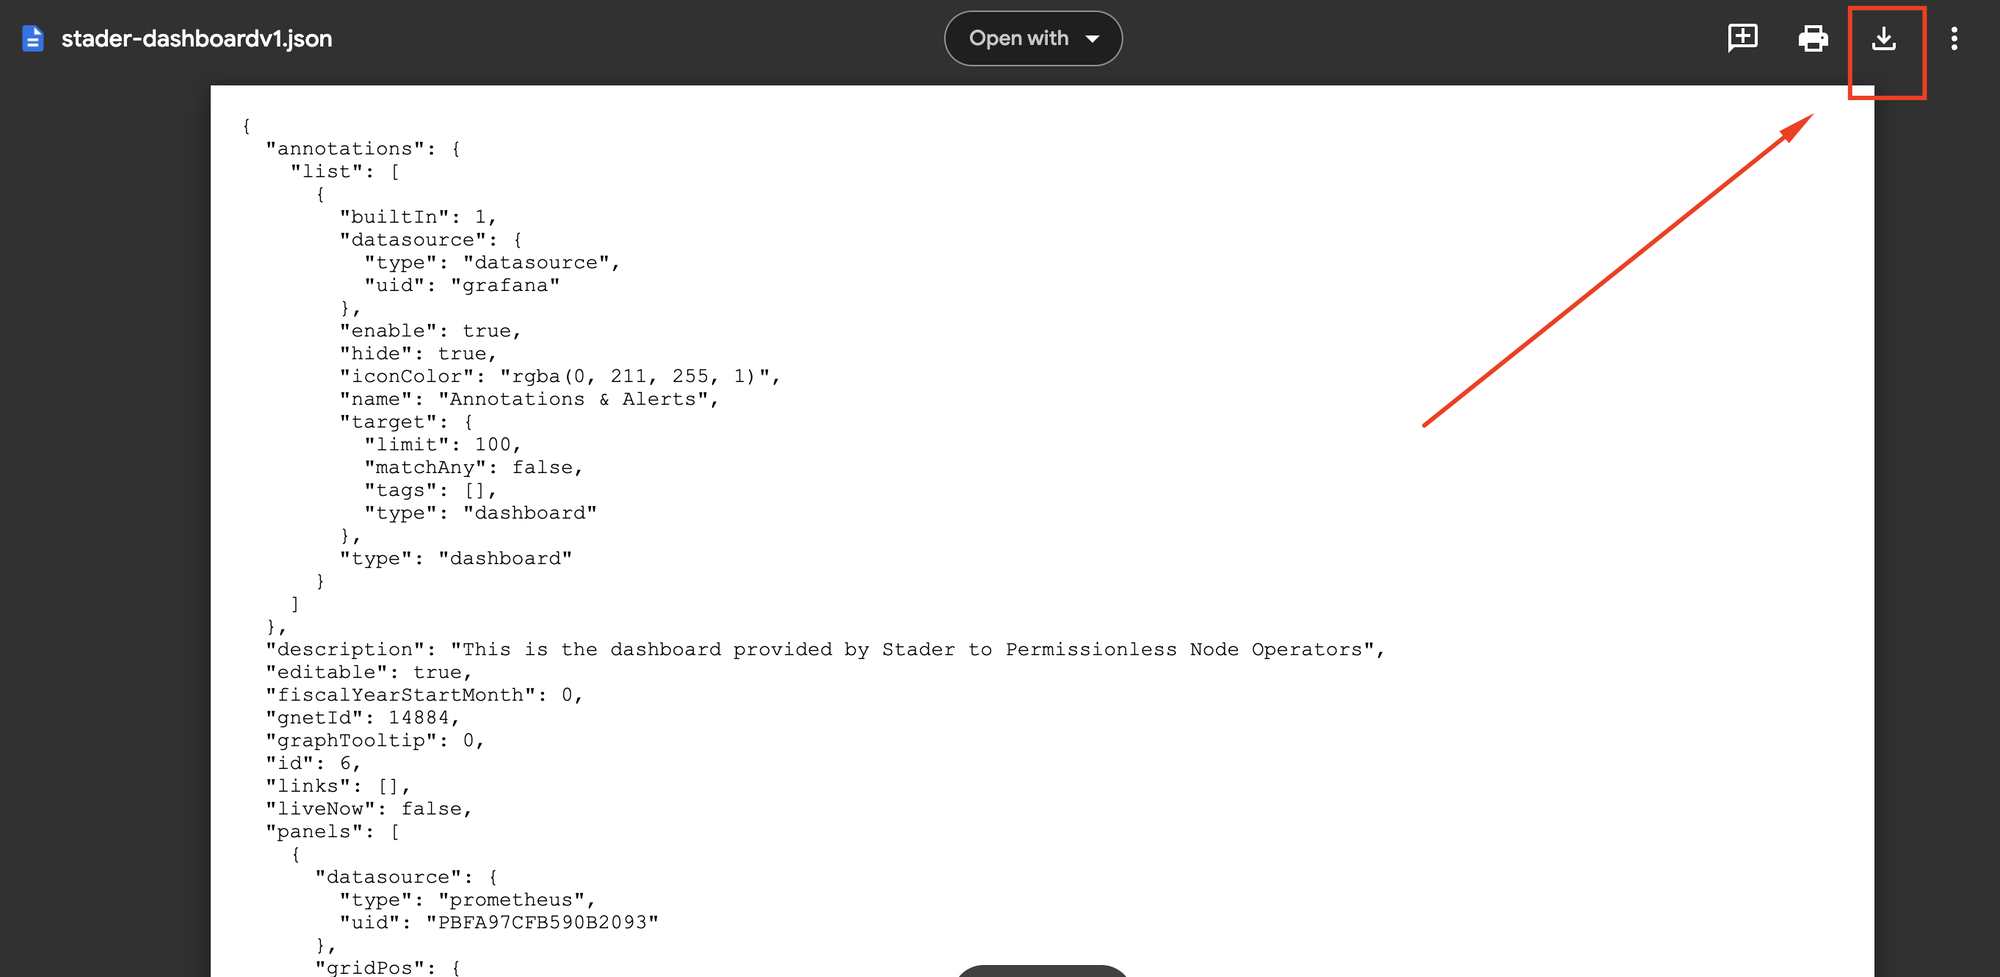
### **Step 3: Download JSON**
[**Click here**](https://drive.google.com/file/d/1t48XOYULP3Rbq_AW6jzjOapifJSy-z17/view?usp=sharing) to download the Stader node Dashboard JSON file
### **Step 4: Import the Grafana dashboard**
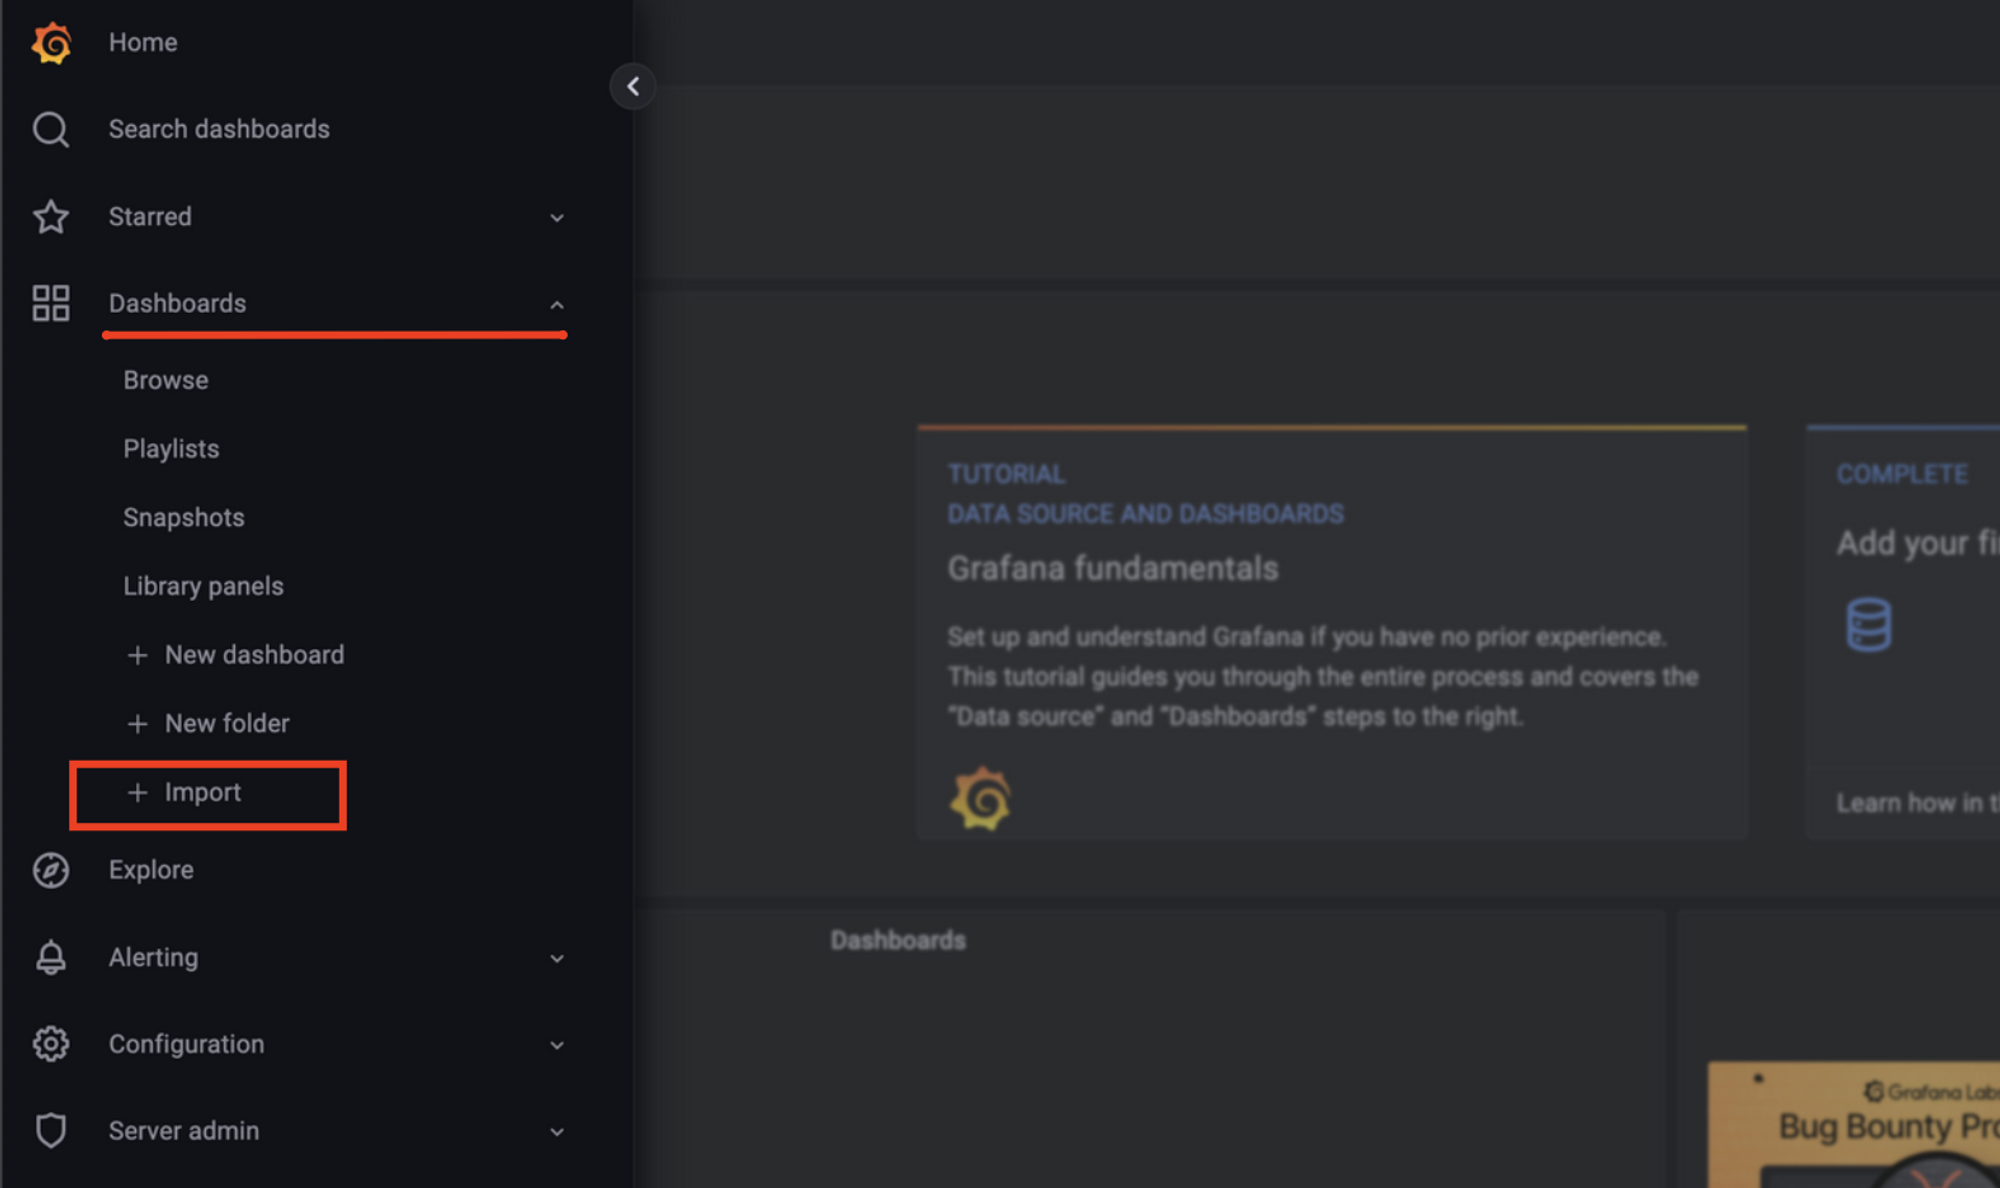
* On the left panel, click on Import under Dashboards
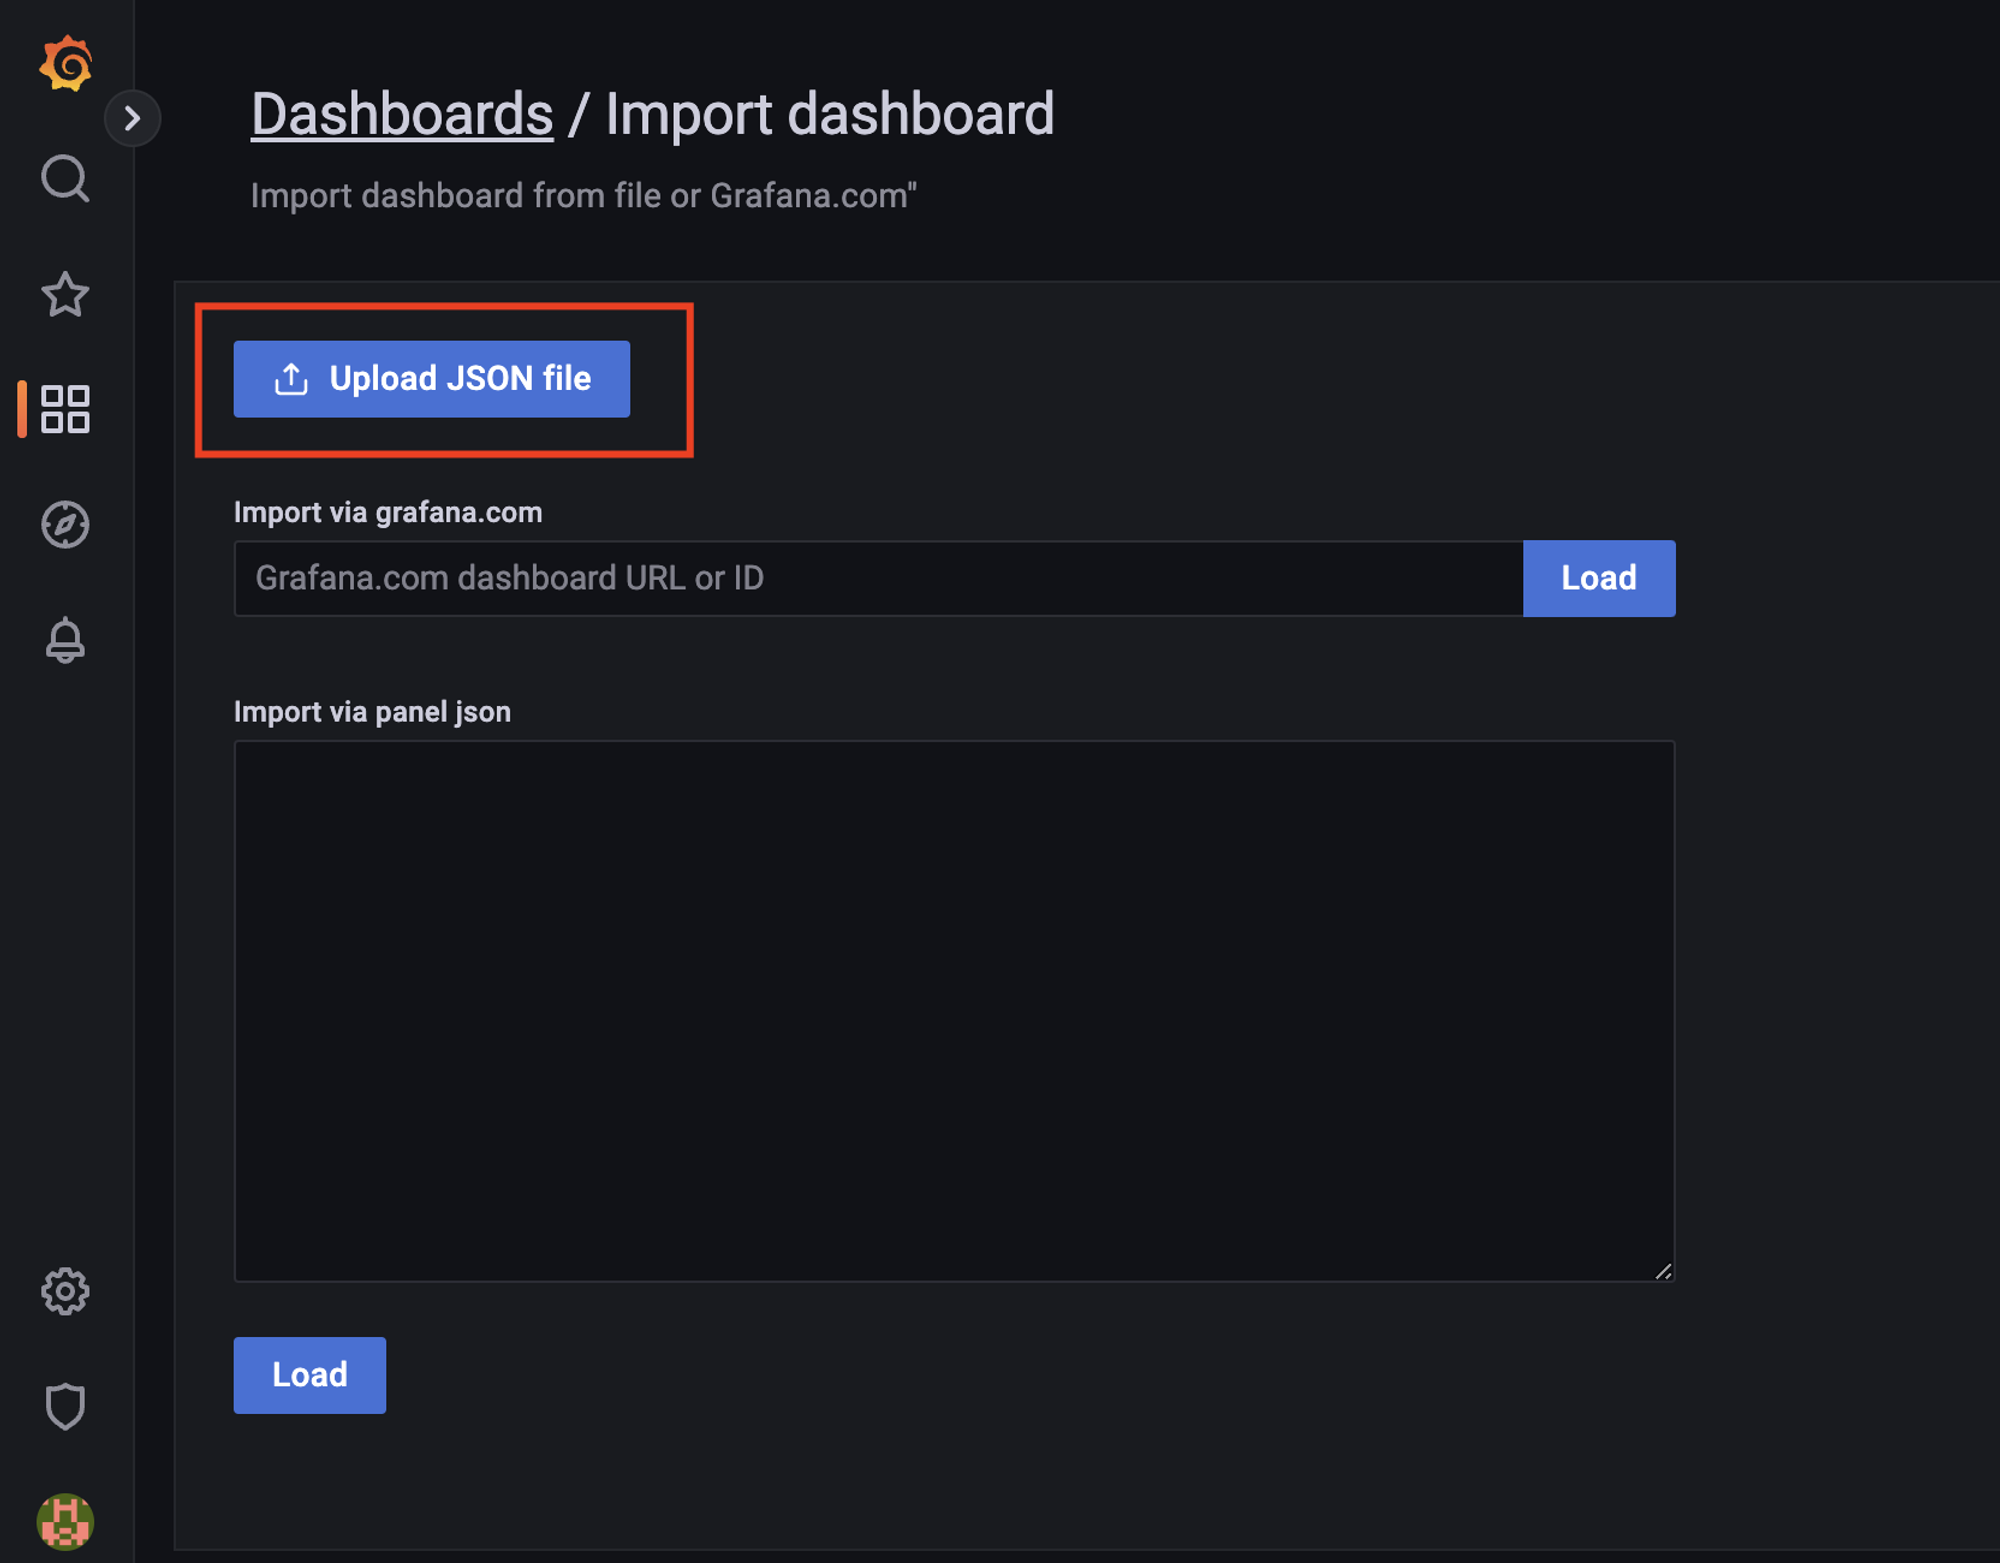
* Upload the JSON file you downloaded in Step 3 by clicking on the “Upload JSON file” CTA
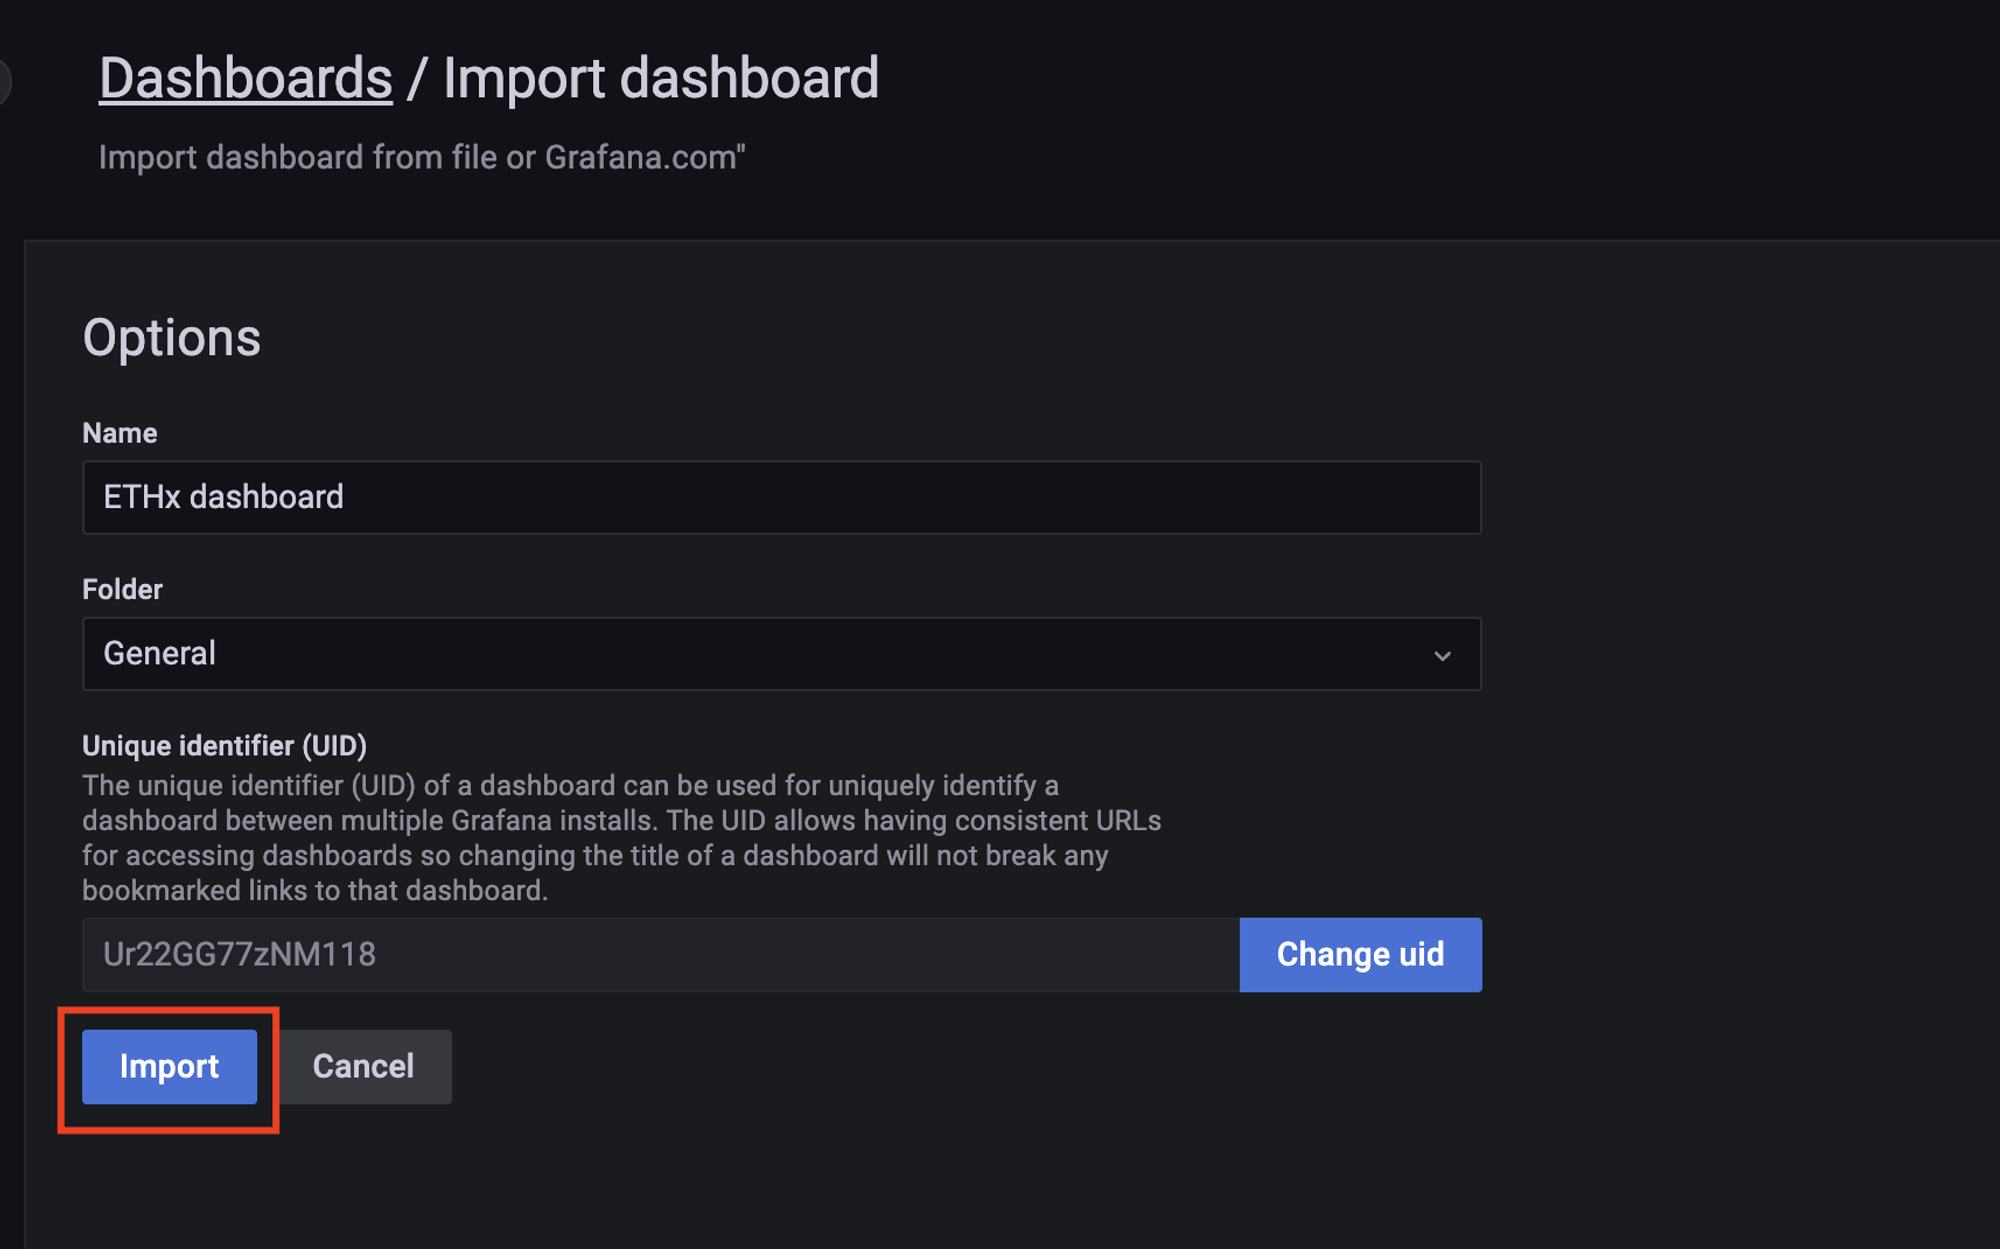
* Click on the Import CTA
{% hint style="warning" %}
**If you see an error saying that the dashboard id has already been taken, just edit the id to some random value by clicking on the “Change uid” button and it should work.**
{% endhint %}
---
# Agent Instructions
This documentation is published with GitBook. GitBook is the documentation platform designed so that both humans and AI agents can read, navigate, and reason over technical content effectively. Learn more at gitbook.com.
## Querying This Documentation
If you need additional information that is not directly available in this page, you can query the documentation dynamically by asking a question.
Perform an HTTP GET request on the current page URL with the `ask` query parameter, and the optional `goal` query parameter:
```
GET https://stader.gitbook.io/stader/ethereum/node-operator/permissionless-node-operator/node-monitoring.md?ask=&goal=
```
`ask` is the immediate question: it should be specific, self-contained, and written in natural language.
`goal` is optional and describes the broader end goal you are ultimately trying to accomplish on behalf of the user. GitBook uses it to tailor the answer towards what is most useful for that goal.
The response will contain a direct answer to the question and relevant excerpts and sources from the documentation.
Use this mechanism when the answer is not explicitly present in the current page, you need clarification or additional context, or you want to retrieve related documentation sections.